Incredibly, December 1st, which represents the start of Meteorological winter (Dec, Jan, Feb), is only a few days away. Winter is upon us and it is time to start thinking about what the winter of 2019-2020 might have in store for New England.
In order to develop an idea for what the winter season may bring in terms of snowfall, we’ll investigate the current state of the following:
- El-Nino Southern Oscillation (ENSO): El Nino, La Nina, or La Nada?
- Eurasian Snowpack
- Solar Cycle
- November Weather Pattern
- Long Range Modeling
When developing a seasonal forecast the goal is to identify the current (and future) atmospheric and oceanic patterns and relate those patterns to previous examples of similar patterns. This is known as developing an analog.
El-Nino Southern Oscillation
The Pacific ocean covers greater than 30% of the Earth’s surface. It’s impact on the Earth system as a whole is significant simply due to its size. The pacific ocean sea surface temperature pattern can have a significant impact on the atmosphere around the globe but particularly the North American continent. You may be familiar with the term El Nino. An El Nino occurs when there is a build up of abnormally warm water along the equator in the Pacific ocean. The opposite, abnormally cold water, is a La Nina. Anything in between, classified as neutral, is commonly referred to as a La Nada, meaning that surface water temperatures along the equator are neither abnormally warm or cold.

Oceanic Nino Index – CPC
The current ENSO mode is that of a La Nada. Three month average surface water temperatures have been 0.1 C above normal for 2 months in a row. To classify as an El Nino, values must be greater than 0.5 C. Less than -0.5 C for La Nina.
Computer projections for the state of the ENSO for the winter continue the theme of near normal sea surface temperatures. Hovering somewhere between 0.1-0.3 C above normal.

ENSO Model Projections
So what does the typical ENSO neutral atmospheric pattern look like?

ENSO Neutral Atmospheric Pattern
The typical La Nada winter-time pattern for the North American continent is shown above. A battle ground between cold air intruding southward from Canada and warm air lifting up from the Pacific and Gulf of Mexico is created over the eastern half of the U.S. where the jet streams tend to combine. This leads to increased storminess for the east coast.
When looking for potential analog years, I used a range of -0.3 – 0.3 C ENSO ONI values for DJF & JFM. The following were identified as analog years. I’ve included the Boston, MA seasonal snowfall for those years. For reference, the long-term average Boston seasonal snow total is 43.8″.

ENSO ONI Analogs & Boston Snow
Eurasian Snow Cover

Eurasian Snow Cover – NOAA
Recent analysis by Dr. Judah Cohen has connected Eurasian snow cover extent during the fall months with the probability of cold outbreaks across the northern hemisphere. October snow cover was above average this year, but has fallen back to near average during November. I’m not sure that any significant conclusions can be deduced with things near average. Perhaps lean cold since October was above average.
Solar Cycle
Did you know that the sun’s energy output is on a cycle? An 11-year cycle to be exact. This cycle is observed by monitoring the number of sun spots on the sun’s surface.

Solar Cycle Example
Currently, the sun is nearing the minimum of solar cycle 24. Research has shown that during the minimum periods there is an increased probability of high latitude atmospheric blocking. This blocking regime is conducive for slow moving storm systems.
November Weather Pattern
Interestingly enough there is a connection between New England’s November temperature departure and a winter’s snowfall total. Below is the analysis performed for Boston.

November Temperature Correlates to Boston Snowfall
Since 2000 only two times did the November rule not work: winter 2000-01 & 2018-19. Meaning there is a high probability of above average snowfall following a November with below average temperatures and vice versa. So, was it cold or warm this November?
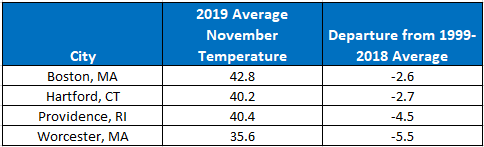
November 2019 Temperature Departures
It’s been pretty cold across Southern New England this month. Based on the November rule, there is a high probability of above average snowfall this DJFM.
Long Range Modeling
A lot of money is spent attempting to simulate the atmosphere and model future outcomes. Computer models are run for various time periods, including seasons. Below are two model simulations for precipitation anomaly forecasts (DJF & JFM). Both highlight that this model is expecting above normal precipitation for the eastern third of the U.S. Particularly for the second half of winter.

ECMWF DJF Precipitation Anomaly – WeatherBell, LLC

ECMWF JFM Precipitation Anomaly – WeatherBell, LLC
Conclusion

Snow Lovers Rejoice
Last year I expected New England to receive slightly above normal snowfall. Unfortunately that didn’t happen in Southern New England as Central & Northern New England ended up with all of the snow. I’m doubling down this year. Based on the information documented above, I’m expecting above average snowfall, particularly in January and February. The neutral ENSO state combined with the solar cycle and November rule, sprinkled with Eurasian snow cover and long range modeling all point towards above normal snow for Southern New England.
-Chris
