Confidence is growing in a significant storm system traveling north along the Eastern Seaboard bringing a mixed bag of precipitation north with it. This storm looks to produce significant impacts to the major cities along the I-95 corridor. Atlanta, Washington, Baltimore, Philly, NYC, Providence, & Boston could all be looking at significant accumulating snow.
However while there is increased confidence in a significant storm, what is lacking confidence at the moment is the track of the storm. And as always, track is everything; especially here in Southern New England where warm air and mixing could become a problem.
What follows below is a series of images from two of our operational computer models, the GFS (American) and the ECMWF (European). I want to highlight the differences between the two and how the end result differs.
With the current atmospheric set up and the development of our potential storm there are 3 key pieces of atmospheric energy at play. One of which has just entered the Californian coast, the other is just west of British Columbia, Canada and the 3rd is over the northern Pacific. The first two pieces of energy are going to combine over the Southeastern states and form our storm while the 3rd is going to track along the Canada/U.S. border and act as a “blocker” to help determine the path of our system as it moves north along the East Coast.
For the following images the image on top will be from the GFS model and on the bottom will be the ECMWF model. For a larger view of each image, click on the image.
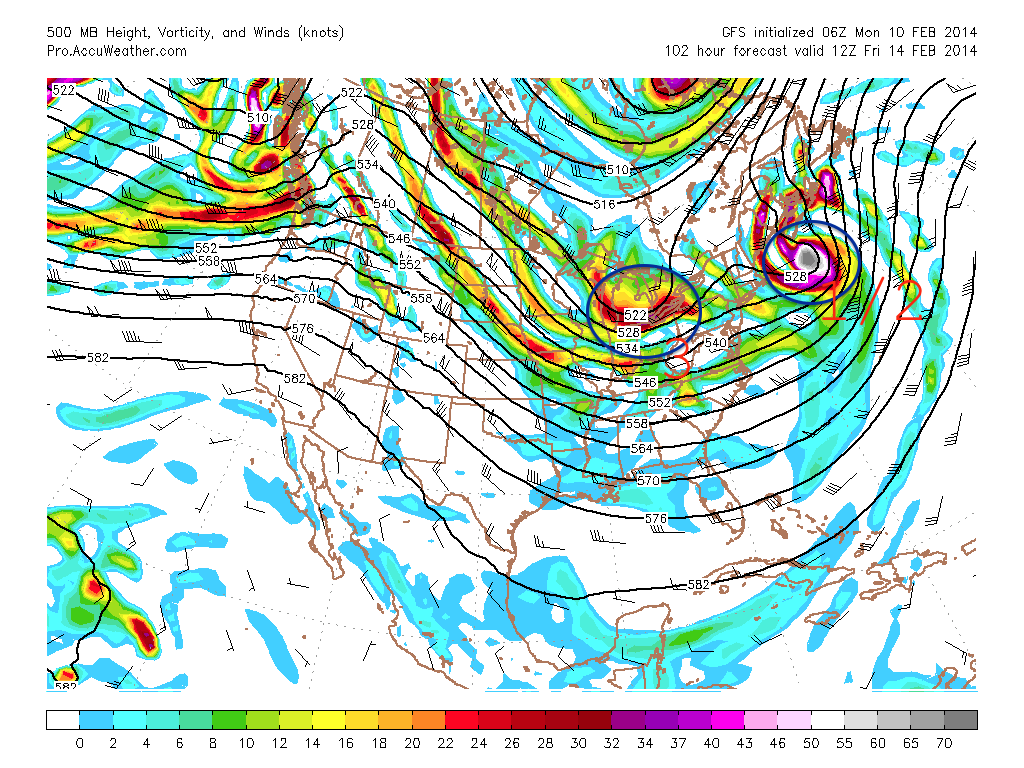
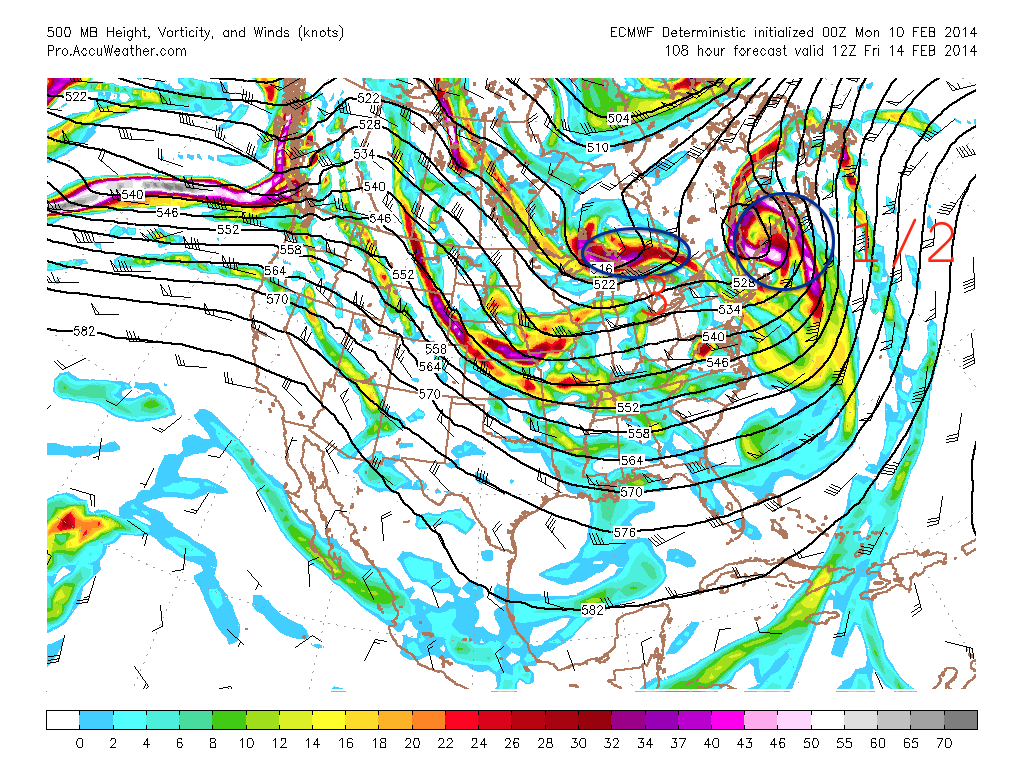
The first two images are 500 mb (17500 ft) vorticity for 7 pm Tuesday night. Remember when we talk vorticity we are talking about energy. In each of the images I have circled and numbered the different areas of interest.
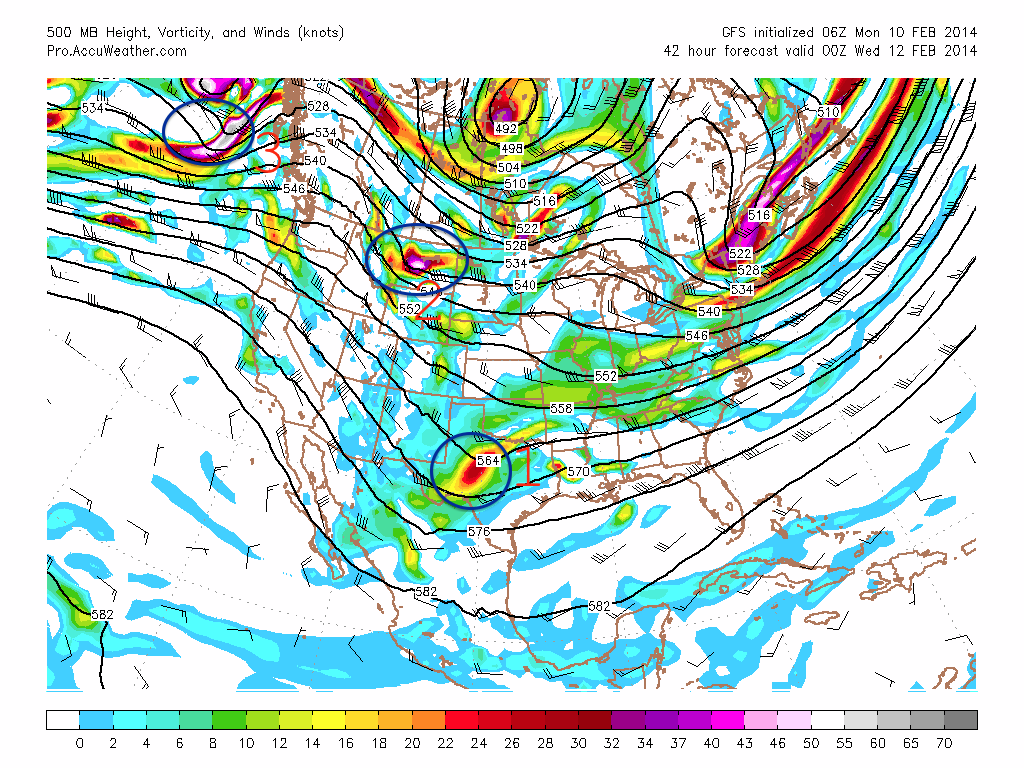
GFS 500 mb 00z Wed
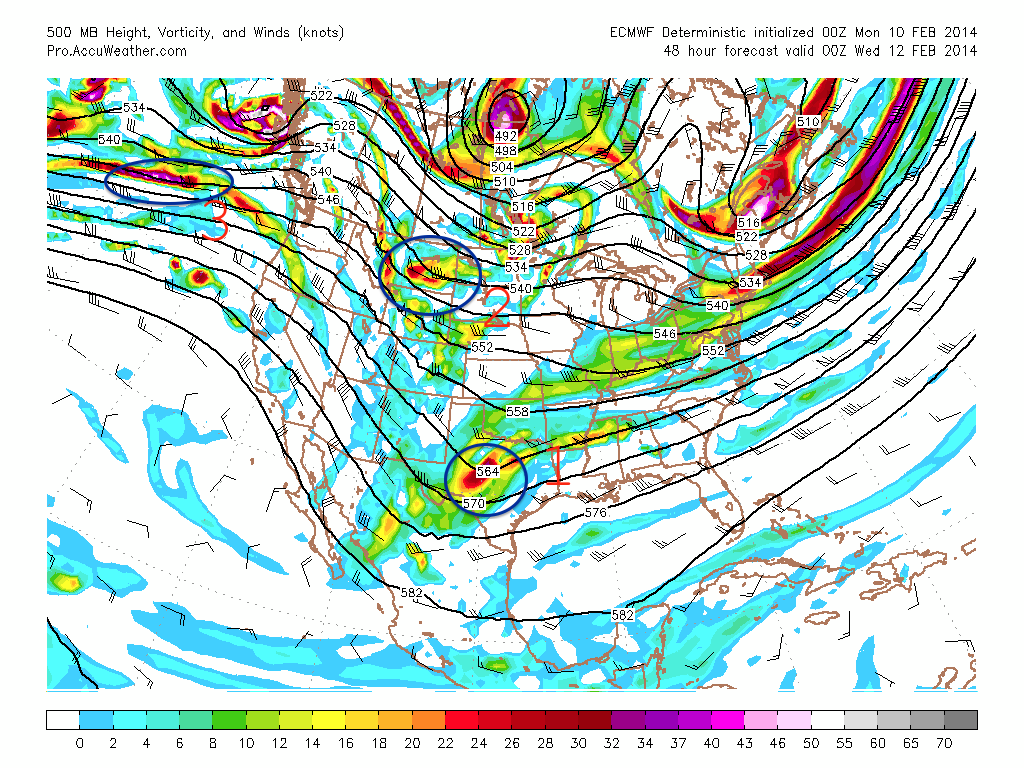
ECMWF 500 mb 00z Wed
Moving forward to 7 am Thursday. Where energy pieces 1 & 2 have phased over the southeast.
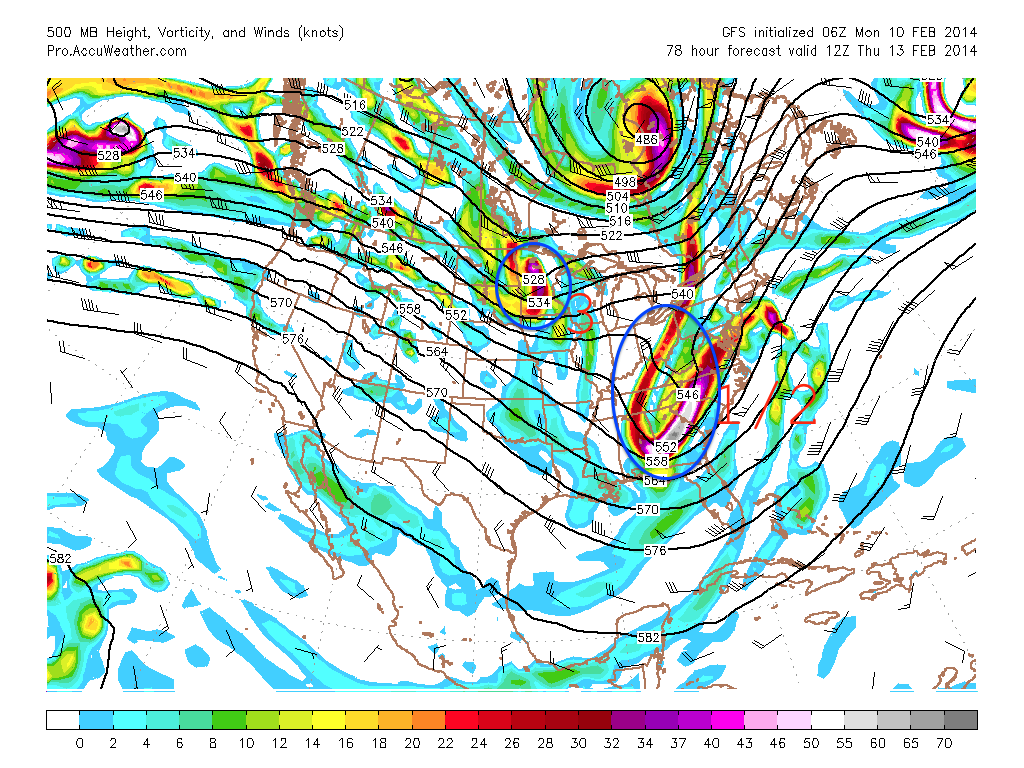
GFS 500 mb 12z Thursday
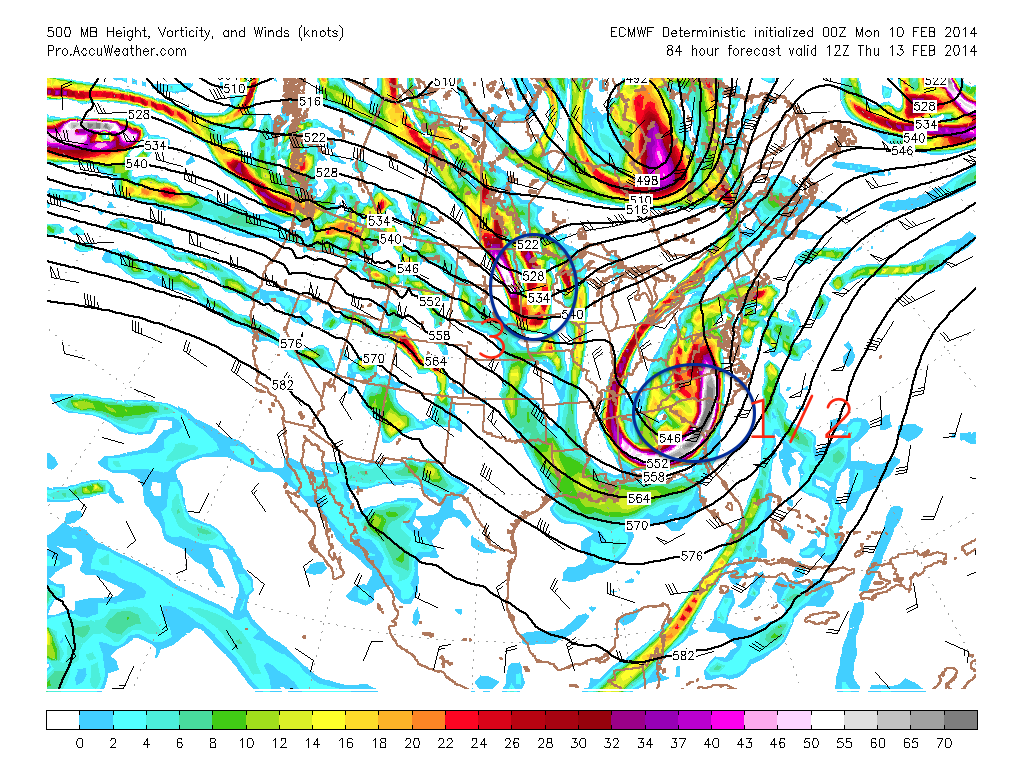
ECMWF 500 mb 12z Thursday
And finally 7 am Friday morning. Where the storm system is passing by New England. Of importance to note is how the ECMWF is further west with the track of the 500 mb energy. As you will see below this causes a further west track of the surface storm center.
GFS 500 mb 12z Friday
ECMWF 500 mb 12z Friday
Now let’s take a look at something that might be a little easier for you to understand. The following images are the surface depiction from the GFS & ECMWF computer models for 7 pm Wednesday night and 7 pm Thursday night. I have marked the maps with L’s and H’s for low and high pressure centers that are at play. The shadings of greens and blues represent total precipitation in the past 6 hours. Light green = less. Blue & light blue = more.
These images are for 7 pm Wednesday night. The storm has developed along the Gulf Coast and is about to traverse across northern Florida and southern Georgia. With origins from the Gulf of Mexico this storm will not be lacking moisture; which could in the end lead to substantial snow totals for those locations that stay all snow on the western side of the storm.
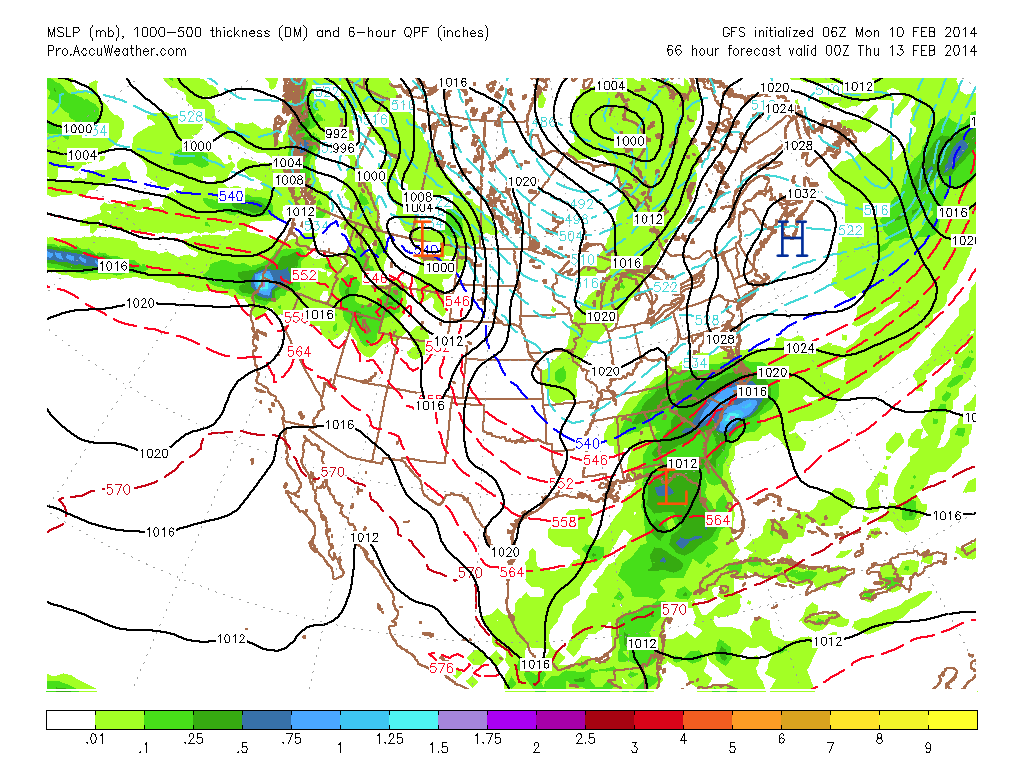
GFS SFC 00z Thursday
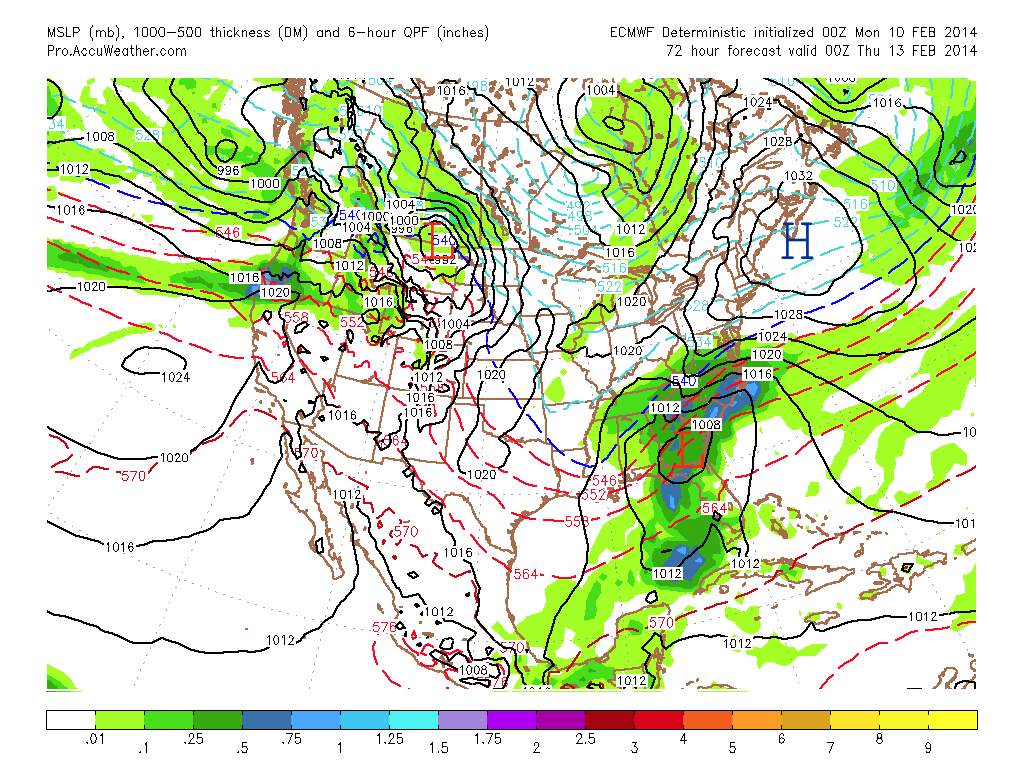
ECMWF SFC 00z Thursday
Moving ahead to 7 pm Thursday evening. High pressure has retreated to the northeast. This will allow warm air to move in across eastern regions of Southern New England in both scenarios. With the track of the ECMWF storm system the warm air pushes even further inland. Making this a very tricky forecast because as always the rain/snow line will play hell with snow totals and drive a forecaster or two bananas.
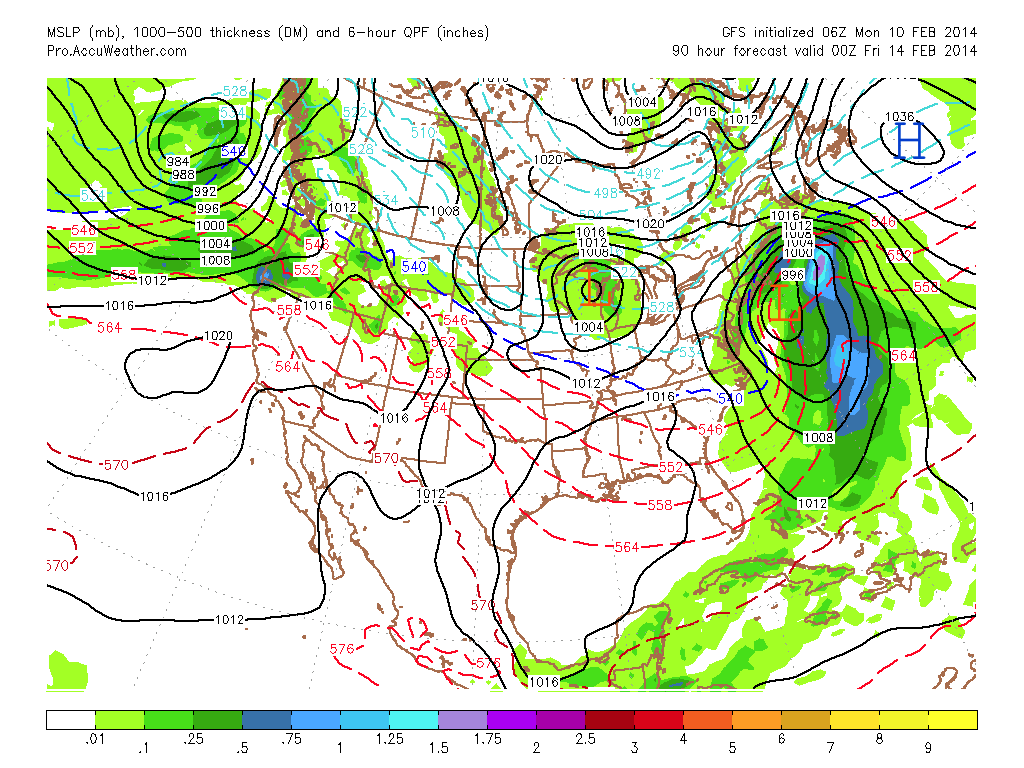
GFS SFC 00z Friday
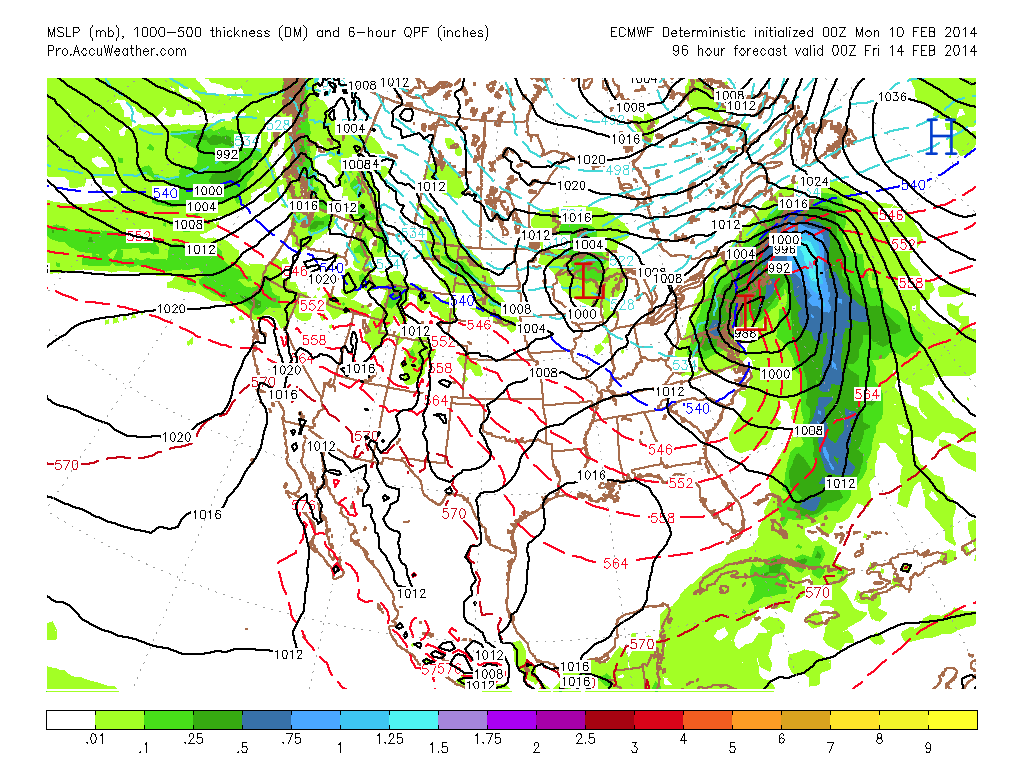
ECMWF SFC 00z Friday
The two images above illustrate how track of the system means everything. The GFS storm center is south of Chatham, MA by 7 pm Thursday evening, while the ECMWF is just east of New York City. The track shown by the ECMWF would lead to mixing and rain making it all the way back to Worcester, MA or possibly further. At the same time if the GFS is correct then the mixing line possibly only makes it back to 495.
We will have to keep a close eye on which direction the models move towards over the coming days. But what the two computer models above lack is wiggle room. So what the meteorological community does is run what we call Ensemble models. We take the same computer model, but change the initial conditions that are put into the model. You do this numerous times and in the end average the solutions together.
Below are three images from three different ensemble mean solutions from the: GFS, ECMWF, and CMC (canadian) for 7 pm Thursday night. In these images I have again marked L’s and H’s for low and high pressures.
GFS
GFS ENS 00z Friday
ECMWF
ECMWF ENS 00z Friday
CMC

CMC ENS 00z Friday
Notice how in the 3 images there is a good consensus that a storm system will be somewhere south of Southern New England by 7 pm Thursday. But the three solutions vary with the placement of the low pressure center. The ECMWF is obviously the furthest west, while the CMC is furthest east.
Also note how the placement of the ECMWF Ensemble low pressure center is east of the ECMWF operational low pressure center. This is a bit of a hint that the operational ECMWF is probably too far west and will likely correct east a bit.
Which leaves the GFS ensemble mean which is basically a blend of the CMC and ECMWF all be it a bit slower. For now will consider the GFS Ensemble mean track of the low pressure as a fairly good forecast based off current guidance.
As for the timeline of this event, this looks to be about a 24 hours event from the early morning hours of Thursday through the early morning horus of Friday. Of course the exact start and end time is likely to change slightly and I will keep an eye on it, but the duration of the event I am fairly confident in.
It is too early in the game to put numbers on a map, but what I will do is try to illustrate the precipitation types that different locations could see with the image below.
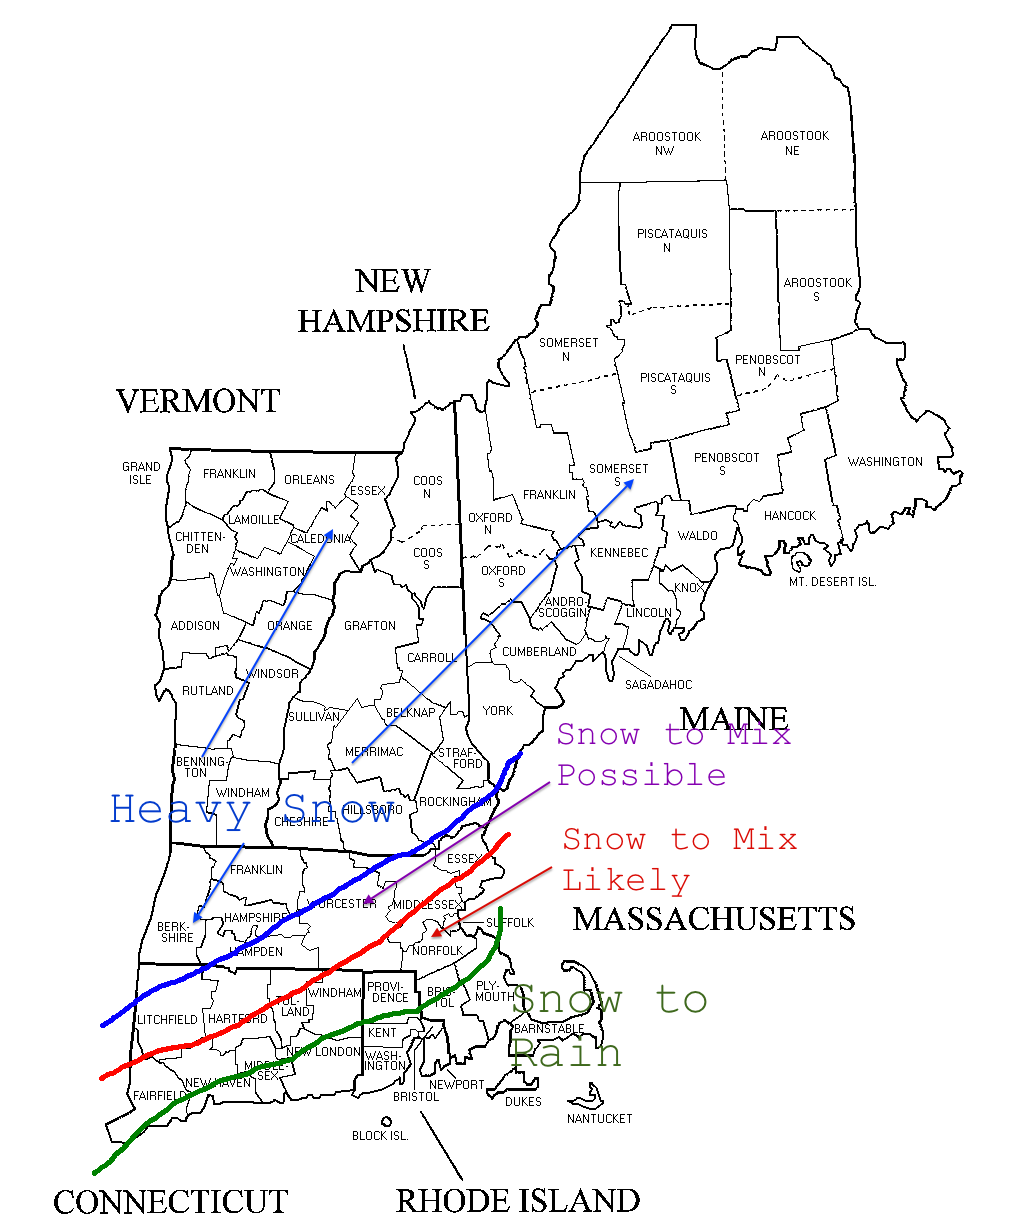
Possible Precipitation Types for Valentine’s Day Storm
-Chris
